| |||


| C/C++ code |
|
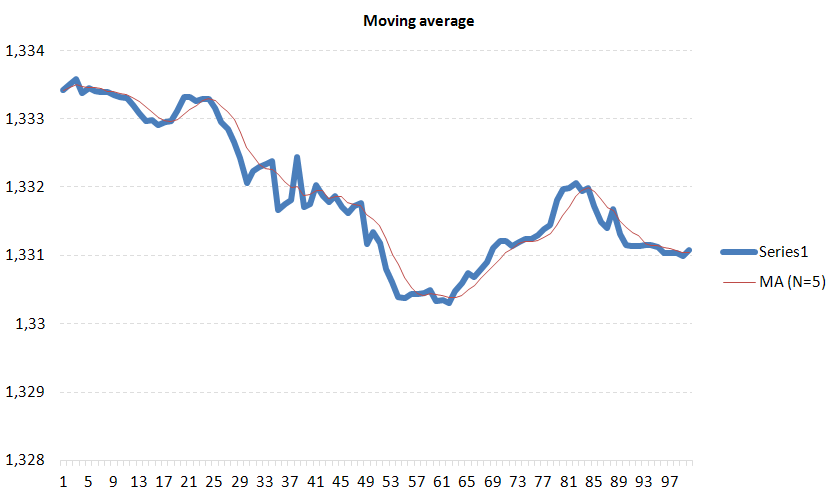
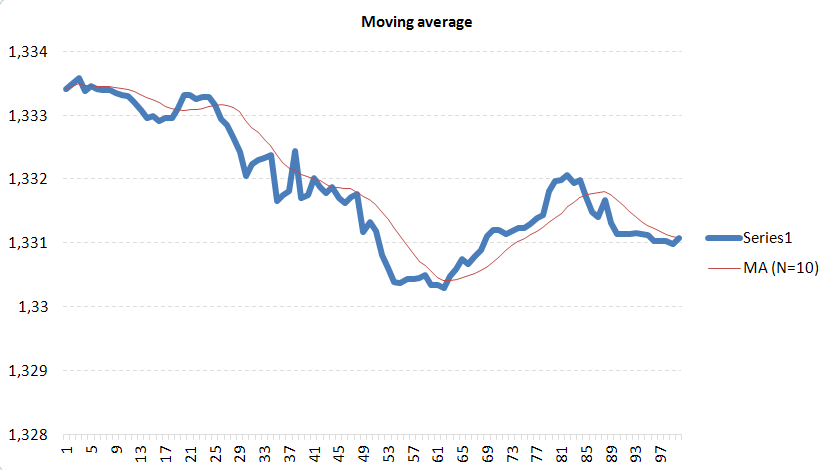
The
DataWindowSelection property is available in each series of data in order to customize the value of N.
| < April > | |||||
| 01 | 02 | 03 | 04 | 05 | |
| 06 | 07 | 08 | 09 | 10 | |
| 11 | 12 | 13 | 14 | 15 | |
| 16 | 17 | 18 | 19 | 20 | |
| 21 | 22 | 23 | 24 | 25 | |
| 26 | 27 | 28 | 29 | 30 | |
DevTools
CPU-Z
EditPlus
ExplorerXP
Kill.exe
OllyDbg
DependencyWalker
Process Explorer
autoruns.exe
Araxis
COM Trace injection
CodeStats
NetBrute
FileMon/Regmon
BoundsChecker
AQTime profiler
Source monitor
GDI leaks tracking
Rootkit revealer
Rootkit removal
RunAsLimitedUser(1)
RunAsLimitedUser(2)
Liens
Le Plan B
Un jour à Paris
Meneame
Rezo.net (aggr)
Reseau voltaire
Cuba solidarity project
Le grand soir
L'autre journal
Le courrier suisse
L'Orient, le jour
Agoravox (aggr)