xlsgen 4.9 improves chart renderings in multiple ways :
- Rendering of treemaps and sunbursts. (outputs : PNG, PDF, SVG)
- Avoid chart element overlap wherever possible, for instance make sure the legend never overlaps with the plot area
- Additional chart element formatting that were not supported in past xlsgen versions
xlsgen 4.9 renders treemaps and sunbursts, charts which were introduced in Excel 2016 and were already supported in read and write. Those two charts are particularly suited when the data being charted is hierarchical in nature. For instance if you have multiple level of time groups in a timeline, or multiple level of particular regions in a geographical division.
The multiple levels are taken as chart categories. Categories usually are a single row or a single column. With multiple levels of depth, it's more than one row or more than one column.
 Rendering treemaps in xlsgen
And here is how you can create this :
xlsgen::IXlsChartPtr chartTreemap = worksheet->NewChart(xlsgen::charttype_treemap,
                                                     9, //row1
                                                     2, //col1
                                                     25, //row2
                                                     9 //col2
                                                     );

chartTreemap->MainTitle->Label = L"treemap";
xlsgen::IXlsChartDynamicDataSourceSeriesPtr s1 = chartTreemap->DynamicDataSource->AddSerie();
s1->SeriesValuesFormula = L"=Sheet1!$D$2:$D$6";
s1->DataLabelsFormula   = L"=Sheet1!$A$2:$C$6"; // Categories with 3 levels of depth

chartTreemap->ExtractAsPNG(L"treemap.png");
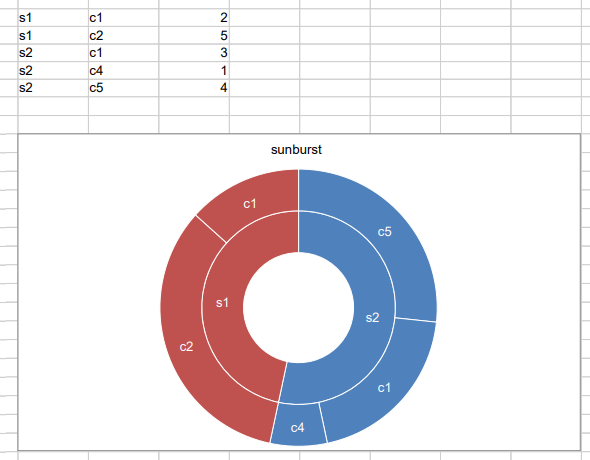 Rendering sunbursts in xlsgen
xlsgen::IXlsChartPtr chartSunburst = worksheet->NewChart(xlsgen::charttype_sunburst,
                                                     27, //row1
                                                     2, //col1
                                                     43, //row2
                                                     9 //col2
                                                     );

chartSunburst->MainTitle->Label = L"sunburst";
xlsgen::IXlsChartDynamicDataSourceSeriesPtr s2 = chartSunburst->DynamicDataSource->AddSerie();
s2->SeriesValuesFormula = L"=Sheet1!$D$2:$D$6";
s2->DataLabelsFormula   = L"=Sheet1!$B$2:$C$6";  // Categories with 2 levels of depth

chartSunburst->ExtractAsSVG(L"sunburst.svg");
As for when to choose sunbursts over treemaps, sunbursts show the entire depth of categories, as in rings, whereas treemaps show a less detailed depth of categories.