Voyez comment fonctionne Apple, extrait : "Uber's trouble continues. In a profile on CEO Travis Kalanick published yesterday, the New York Times says that the Uber CEO was called into Apple for a private meeting with CEO Tim Cook. Kalanick had directed Uber's developers to break Apple's App Store rules—he wanted the Uber app to collect unique hardware data about every iPhone it was installed on, something Apple's App Store rules don't allow. To obscure this from Apple's App Review team, Kalanick asked his engineers to make it so that the app wouldn't collect that data from anyone at Apple's headquarters.
This was eventually noticed by Apple engineers working off-campus, prompting the meeting with Cook. Cook told Kalanick to stop collecting the data or face ejection from the App Store, cutting the app off from a wide swath of the company's user base. Kalanick agreed.
" Apple prétend faire de la sécurité des données personnelles leur plus grande chasse gardée. Et en fait il suffit à une application de ne pas faire lorsqu'elle est utilisée depuis un bureau de chez Apple ce qu'elle fait ailleurs, pour passer entre les gouttes. Un peu le volkswagen du smartphone. Mais c'est le principe libéral derrière qui en dit le plus sur cette société. Je ne parle pas d'Uber, qui exploite ce qu'on lui permet d'exploiter. Je parle de Apple qui n'est finalement qu'un bras droit du commerce international, du libéralisme et en plus de la NSA. Beurk. |  |  |
Posted on 25-April-2017 09:39 | Category: France | comment[0] | trackback[0]
Sans surprise, Microsoft publie une semaine après le leak de certains outils NSA capables de s'infiltrer dans Windows, des patchs pour les en empêcher. Mais l'essentiel est dans le détail. Les vulnérabilités sont très anciennes, pour ainsi dire préhistoriques, puisque elles concernent notamment OLE, une petite librairie dans Windows qui sert à faire le copier/coller et qui, de toute évidence, avait toutes les raisons d'être patchée depuis très longtemps.
Pas patchée depuis longtemps malgré l'évidence, alors pourquoi?
La réponse est dans le leak snowden. Microsoft ne patche pas des vulnérabilités et les transmet à la NSA pour que la NSA puisse infiltrer des ordinateurs Windows. Ce qui rend Microsoft complice, et non la caricature d'innocence qu'ils prétendent avoir.
Quand on sait, qu'en plus de volontairement et intentionnellement ne pas supprimer des vulnérabilités, et les transmettre à la NSA, Microsoft force l'usage de Windows spy edition, autrement connue sous le nom Windows 10, qui transmet toutes les dix minutes le journal de votre activité sur votre ordinateur, complet avec le nom des applications utilisées, les identifiants matériels et logiciels, on se dit que la totalité des gouvernements de la planète, dont une des fonctions est de défendre l'intérêt général, est de traduire Microsoft en justice et de lui infliger des peines si lourdes que nous serions débarrassés de ces gens là. Autre alternative, que Windows devienne open source puis que des gens avec suffisamment de temps devant eux fassent une version de base pour tout le monde, propre, de façon à ce que les entreprises puisse utiliser Windows de manière transitoire avant une migration définitive vers Linux.
| | |
Posted on 18-April-2017 09:11 | Category: anti-Microsoft | comment[0] | trackback[0] Build 4.0.0.90 of xlsgen brings supports to resistance trendlines, for financial decision making. Support and resistance trendlines are used in stock trading to delimit peer pressure for, respectively, selling and buying stocks. Any time the stock data crosses the support line or the resistance line, this acts as a trade signal. Support and resistance play an opposite role. The support line marks the signal for selling stocks, or for shorting stocks (i.e. buying on the prediction that stocks will go lower). The resistance line marks the signal for buying stocks, or for longing stocks (i.e. buying on the prediction that stocks will go higher).  Support and Resistance trend lines in xlsgen Support and Resistance trend lines in xlsgenxlsgen completely hides the underlying complexity of calculating support and resistance trendlines. Those lines are calculated based on 10-period smoothed data and the calculation of local minimum and maximum spots which are then interpolated together. | C/C++ code | xlsgen::IXlsWorkbookPtr workbook = engine->Open( L"EURUSD1.csv", L"support_resistance.xlsx" );
xlsgen::IXlsChartPtr chart = workbook->WorksheetByIndex[1]->NewChart(xlsgen::charttype_line2D,
1, //row1
2, //col1
28, //row2
15 //col2
);
xlsgen::IXlsChartDynamicDataSourceSeriesPtr serie001s0ss0 = chart->DynamicDataSource->AddSerie();
serie001s0ss0->SeriesValuesFormula = L"=R1C3:R100C3";
chart->SeriesByIndex[1]->TrendLines[1]->Show = xlsgen::charttrendline_support; // Support trendline
chart->SeriesByIndex[1]->TrendLines[1]->Options->Type = xlsgen::chartbordertype_custom;
chart->SeriesByIndex[1]->TrendLines[1]->Options->Style = xlsgen::chartborderstyle_dot;
chart->SeriesByIndex[1]->TrendLines[1]->Options->Weight = xlsgen::chartborderweight_single;
chart->SeriesByIndex[1]->TrendLines[1]->Options->Color = 0xFF0000;
chart->SeriesByIndex[1]->TrendLines[2]->Show = xlsgen::charttrendline_resistance; // Resistance trendline
chart->SeriesByIndex[1]->TrendLines[2]->Options->Type = xlsgen::chartbordertype_custom;
chart->SeriesByIndex[1]->TrendLines[2]->Options->Style = xlsgen::chartborderstyle_dot;
chart->SeriesByIndex[1]->TrendLines[2]->Options->Weight = xlsgen::chartborderweight_single;
chart->SeriesByIndex[1]->TrendLines[2]->Options->Color = 0x00FF00;
workbook->WorksheetByIndex[1]->Export->ExportAsPDF(L"support_resistance.pdf"); // ask xlsgen to compute and render it
workbook->Close();
|
| | |
Posted on 12-April-2017 08:40 | Category: xlsgen, Excel generator | comment[0] | trackback[0] Build 4.0.0.89 of xlsgen adds support trendlines to financial analysis tooling. Support trendlines are used in stock trading to delimit peer pressure for selling stocks. Any time the stock data crosses the support line, this acts as a trade signal. The support line marks the signal for selling stocks, or for shorting stocks (i.e. buying on the prediction that stocks will go lower). 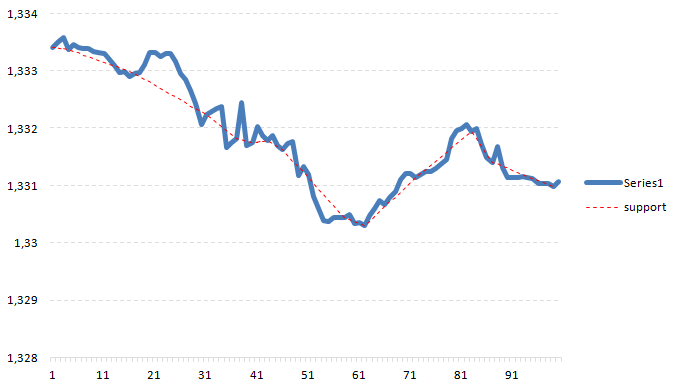 Support trend lines in xlsgen Support trend lines in xlsgen | | |
Posted on 12-April-2017 08:37 | Category: xlsgen, Excel generator | comment[0] | trackback[0]
Apparently at least one government or one large customer is giving pressure Microsoft to Windows spy edition also known as Windows 10. And Microsoft has listed all the fields that their spy procedure grabs and sends to Microsoft without any user consent.
And without much surprise, those fields include ALL device identifiers, that is unique elements that identify you for the lifetime of the computer.
Given that, this spy procedure is executed every few minutes, the outcome of this is that this is a massive theft of personal data that tracks every move of you.
It goes without saying that this is a criminal activity and that every one in the world, not just corporations or governments, just about everyone should sue Microsoft to death. They are doing what even the NSA isn't. Or, in other words, they have built the spy procedures that the NSA may find handy whenever they ask Microsoft for such information.
In other words, Microsoft is an enemy and Windows spy edition, also known as Windows 10, is a hostile environment.
Such an hostile environment that privacy-aware persons should never put this thing online.
It's a very dramatic departure from what the Windows genuine advantage did until Windows spy edition. The Windows genuine advantage (which is used to activate a Windows license since Vista) did the same, by that I mean, grabbed all sorts of unique hardware identifiers and send it to Microsoft, but at least they did it ONCE, for the license to activate, and never again. See the difference?
The difference is what is a legit license activation process versus a 100% criminal software.
| | |
Posted on 10-April-2017 19:49 | Category: anti-Microsoft | comment[0] | trackback[0] Build 4.0.0.88 of xlsgen adds support for the MACD chart. The MACD chart (short for Moving average convergence divergence) is a trend chart often used for stock trading. It is made of two lines and one bar. Wikipedia article.  MACD (the input data is in blue, everything else is the MACD) MACD (the input data is in blue, everything else is the MACD)The first line is the signal line and is a two pass filter. Its scale is represented on the secondary Y axis. The second line, the average line, is a low pass filter of the signal line. And finally the bar chart is the difference between the two. Both are attached to the secondary Y axis. Interpretation for trading :
- A "signal-line crossover" occurs when the MACD and average lines cross; that is, when the bar chart changes sign. The standard interpretation of such an event is a recommendation to buy if the MACD line crosses up through the average line (a "bullish" crossover), or to sell if it crosses down through the average line (a "bearish" crossover). These events are taken as indications that the trend in the stock is about to accelerate in the direction of the crossover.
- A "zero crossover" event occurs when the MACD series changes sign, that is, the MACD line crosses the horizontal zero axis. This happens when there is no difference between the fast and slow EMAs of the price series. A change from positive to negative MACD is interpreted as "bearish", and from negative to positive as "bullish". Zero crossovers provide evidence of a change in the direction of a trend but less confirmation of its momentum than a signal line crossover.
| C/C++ code |
xlsgen::IXlsWorkbookPtr wbk = engine->Open( L"EURUSD1.csv", L"output.xls" );

xlsgen::IXlsChartPtr chart1 = wbk->WorksheetByIndex[1]->NewChart(xlsgen::charttype_macd, row1, col1, row2, col2);
xlsgen::IXlsChartDynamicDataSourceSeriesPtr serie1 = chart1->DynamicDataSource->AddSerie();
serie1->SeriesValuesFormula = L"=R1C3:R100C3";
|
| | |
Posted on 06-April-2017 19:43 | Category: xlsgen, Excel generator | comment[0] | trackback[0] Build 4.0.0.87 of xlsgen adds support for the exponential moving average trendline. The exponential moving average, as the name suggests, is an exponentially decreasing moving average which means recent data in the moving window has more weight than older data. The exponential moving average is closer visually to the series data than the regular moving average and reveals trends like the moving average. It can improve the decision based on the trend analysis.  Exponential moving average (N=20 values in the data window) versus moving average Exponential moving average (N=20 values in the data window) versus moving averageCreating the trendline is straight forward :
| C/C++ code |
xlsgen::IXlsWorkbookPtr workbook = engine->Open( L"EURUSD1.csv", L"exponential_moving_average.xls" );

xlsgen::IXlsChartPtr chart = workbook->WorksheetByIndex[1]->NewChart(xlsgen::charttype_line2D,
                                                     1, //row1
                                                     2, //col1
                                                     28, //row2
                                                     15 //col2
                                                     );

xlsgen::IXlsChartDynamicDataSourceSeriesPtr serie001s0ss0 = chart->DynamicDataSource->AddSerie();
serie001s0ss0->SeriesValuesFormula = L"=R1C3:R100C3";

chart->SeriesByIndex[1]->TrendLines[1]->Show = xlsgen::charttrendline_exponentialmovingaverage; // exponential moving average trendline
chart->SeriesByIndex[1]->TrendLines[1]->MovingAveragePeriods = 20; // N=20

workbook->WorksheetByIndex[1]->Export->ExportAsPDF(L"exponential_moving_average.pdf"); // ask xlsgen to compute and render it

workbook->Close();
|
| | |
Posted on 03-April-2017 09:08 | Category: xlsgen, Excel generator | comment[0] | trackback[0]
Après la France et le Royaume-uni, c'est au tour des Etats-unis de voter la possibilité pour les fournisseurs d'accès à internet de revendre vos données personnelles de connection et de navigation à des tiers : publicité, surveillance, c'est au mieux disant comme dirait l'autre.
Qu'on ne vienne pas me parler de démocratie.
Et surtout que les trous du cul qui vociféraient il y a quelques années parce que un certain colonel khadafi venait de faire l'acquisition de boites noires pour surveiller l'internet libyien, ces gens là en particulier, gauchistes et souvent anti-fascistes, auront fait le travail d'idiots utiles (qu'ils ont toujours été dans l'histoire) pour ceux qui ont réellement le pouvoir.
Aujourd'hui si vous voulez être tranquille vous n'avez plus d'autre choix que de commencer à limiter votre temps de connection.
Mais les fournisseurs d'accès veulent l'inverse. D'où l'arrivée imminente des forfaits mobiles illimités.
A bon entendeur...
| | |
Posted on 29-March-2017 12:01 | Category: France | comment[0] | trackback[0]
At least it's starting a theme. 3 US citizens are sueing Microsoft for forced upgrade and data loss related to Windows 10.
I am surprised it did not happen earlier. And I am even more surprised that governments out there haven't sued Microsoft yet, especially when you know that governments are supposed to represent the general interest. Perhaps that speaks volume about governments these days (and election is coming...)
I am surprised nobody yet has sued Microsoft for the active spying which is part of Windows 10 and which was rolled back to Windows 7 and Windows 8 as well. That Microsoft should phone home with the list of applications you are using, how often you are using them, and probably much much more, is all you have to know on the subject.
I myself got a little bit shielded from all this. To any computer (physical or virtual) running Windows XP or earlier systems, Microsoft did not even try to update them, so that was not a problem. For my computer running Windows 7, I simply turn Windows update off as soon as the system got installed and OEM drivers up to date. Thanks to this, I am never bothered with anything. Just make sure, if you do this, to have discipline too, because that helps. For instance, never use Internet Explorer. Also, for emails, configure them to read them as plain text, and always take a look at the internal email headers whenever you get an email from a stranger who would like you to open a piece in attachment.
| | |
Posted on 26-March-2017 09:32 | Category: anti-Microsoft | comment[0] | trackback[0] Build 4.0.0.86 of xlsgen adds a new trend line to the list of existing trend lines : moving median.  Moving median (N=5 values in the data window) Moving median (N=5 values in the data window)The moving median, as the name suggests, builds on a median computed inside a moving data window (subset of the series of data). The series of the median values as the window moves makes the trend line. The median is a measure by which half of the data is below it, and the other half is above it. Wikipedia article. Compared to a moving average, the moving median reflects a lot less brutal changes, which are sometimes viewed, depending on the business using it, as skewed or useless values. And here is how to create it :
| C/C++ code |
xlsgen::IXlsWorksheetPtr wksht001 = workbook->AddWorksheet( L"Sheet1" );

// data
wksht001->Cell[2][2]->HtmlFloat = L"<font color=#000000 size=11 name=\"Calibri\">50</font>";
wksht001->Cell[3][2]->HtmlFloat = L"<font color=#000000 size=11 name=\"Calibri\">30</font>";
wksht001->Cell[4][2]->HtmlFloat = L"<font color=#000000 size=11 name=\"Calibri\">100</font>";
wksht001->Cell[5][2]->HtmlFloat = L"<font color=#000000 size=11 name=\"Calibri\">40</font>";
wksht001->Cell[6][2]->HtmlFloat = L"<font color=#000000 size=11 name=\"Calibri\">200</font>";
wksht001->Cell[7][2]->HtmlFloat = L"<font color=#000000 size=11 name=\"Calibri\">70</font>";
wksht001->Cell[8][2]->HtmlFloat = L"<font color=#000000 size=11 name=\"Calibri\">100</font>";
wksht001->Cell[9][2]->HtmlFloat = L"<font color=#000000 size=11 name=\"Calibri\">10</font>";
wksht001->Cell[10][2]->HtmlFloat = L"<font color=#000000 size=11 name=\"Calibri\">150</font>";
wksht001->Cell[11][2]->HtmlFloat = L"<font color=#000000 size=11 name=\"Calibri\">250</font>";

// chart
xlsgen::IXlsChartPtr chart001s0 = wksht001->NewChart(xlsgen::charttype_bar2D, 5, 1, 20, 8);

xlsgen::IXlsChartDynamicDataSourceSeriesPtr serie001s0ss0 = chart001s0->DynamicDataSource->AddSerie();
serie001s0ss0->SeriesValuesFormula = L"Sheet1!$B$2:$B$11";
chart001s0->SeriesByIndex[1]->TrendLines[1]->Show = xlsgen::charttrendline_movingmedian; // moving median trendline
chart001s0->SeriesByIndex[1]->TrendLines[1]->MovingAveragePeriods = 5; // N=5

wksht001->Export->ExportAsPDF(L"moving_median.pdf"); // ask xlsgen to compute and render it

workbook->Close();
|
| | |
Posted on 24-March-2017 12:16 | Category: xlsgen, Excel generator | comment[0] | trackback[0] Build 4.0.0.85 of xlsgen makes it possible to add more than one trendline to a series of data. Before this build, for 3 series of data there could be at most 3 trendlines attached to them, so up to 6 lines in total.  One series of data and 4 trendlines attached to it (moving averages with different parameters) One series of data and 4 trendlines attached to it (moving averages with different parameters)This works for XLS and XLSX/XLSB files. And here is how to code it :
xlsgen::IXlsWorkbookPtr wbk = engine->Open( L"input\\EURUSD1.csv", L"multiple_trendlines.xlsx" );

xlsgen::IXlsChartPtr chart = wbk->WorksheetByIndex[1]->NewChart(xlsgen::charttype_line2D,
					     1, //row1
					     2, //col1
					     28, //row2
					     15 //col2
					     );

xlsgen::IXlsChartDynamicDataSourcePtr datasource001s0 = chart->DynamicDataSource;

xlsgen::IXlsChartDynamicDataSourceSeriesPtr serie001s0ss0 = datasource001s0->AddSerie();
serie001s0ss0->SeriesValuesFormula = L"=R1C3:R100C3";
chart->SeriesByIndex[1]->TrendLines[1]->Show = xlsgen::charttrendline_movingaverage;
chart->SeriesByIndex[1]->TrendLines[1]->MovingAveragePeriods = 5;
chart->SeriesByIndex[1]->TrendLines[1]->Options->Type = xlsgen::chartbordertype_custom;
chart->SeriesByIndex[1]->TrendLines[1]->Options->Color = 0x4040C0;
chart->SeriesByIndex[1]->TrendLines[2]->Show = xlsgen::charttrendline_movingaverage;
chart->SeriesByIndex[1]->TrendLines[2]->MovingAveragePeriods = 10;
chart->SeriesByIndex[1]->TrendLines[2]->Options->Type = xlsgen::chartbordertype_custom;
chart->SeriesByIndex[1]->TrendLines[2]->Options->Color = 0xC04040;
chart->SeriesByIndex[1]->TrendLines[3]->Show = xlsgen::charttrendline_movingaverage;
chart->SeriesByIndex[1]->TrendLines[3]->MovingAveragePeriods = 20;
chart->SeriesByIndex[1]->TrendLines[3]->Options->Type = xlsgen::chartbordertype_custom;
chart->SeriesByIndex[1]->TrendLines[3]->Options->Color = 0x40C040;
chart->SeriesByIndex[1]->TrendLines[4]->Show = xlsgen::charttrendline_movingaverage;
chart->SeriesByIndex[1]->TrendLines[4]->MovingAveragePeriods = 40;
chart->SeriesByIndex[1]->TrendLines[4]->Options->Type = xlsgen::chartbordertype_custom;
chart->SeriesByIndex[1]->TrendLines[4]->Options->Color = 0xA040A0;


chart->XAxis[xlsgen::chartaxis_primary]->Scale->ItemsBetweenTickMarkLabels = 10;

wbk->Close();
| | |
Posted on 24-March-2017 11:38 | Category: xlsgen, Excel generator | comment[0] | trackback[0]
Build 4.0.0.84 of xlsgen is a fix pack for improving the rendering of charts and other objects. The improvements include :
- charts : support for item spacing on the X-axis. This property allows to avoid drawing a label next to each tick, which is useful when the chart in question has a large data source attached to it.
- charts : border line weight takes into account the line weight inferred from the chart style (48 chart styles) whenever there isn't a custom setting.
- better preserve and render border styles in text boxes, vector shapes, pictures and chart elements. There was a discrepancy between chart border styles, MSO border styles and XLSX/XLSB border styles.
| | |
Posted on 24-March-2017 09:20 | Category: xlsgen, Excel generator | comment[0] | trackback[0]
Build 4.0.0.83 of xlsgen includes two fixes for the built-in calculation engine. Namely,
- HLOOKUP/VLOOKUP functions : correct handling of optional parameter when passed as an integer instead of a boolean.
- INDIRECT function : correct handling of area reference case.
| | |
Posted on 21-March-2017 13:25 | Category: xlsgen, Excel generator | comment[0] | trackback[0] According to ArsTechnica, Qualcomm is about to begin selling chips for addressing modern phone networks using feature phones, i.e. phones that are not smartphones at all. I see it as an ironic albeit natural change in market offering. After all, there is a great number of people out there who either can't afford premium smartphones, and a growing number of people who have used one and have become desillusioned about the whole thing : the awful tactile screen, eye fatigue, tiny screen, bad phone call sound, bad music, awful battery autonomy, not to mention the risk of the whole thing fuming or even exploding. Plus all the bad habits that come with it, that is, for many advertisers and their clients, a smartphone is little else than a super targeted vehicle for selling their crap. Feature phone is at complete odds with all the above. It's a phone for making a phone call! believe it or not ! The thing is, so far, feature phones don't support 3G ou 4G networks. This lack is about to end. | | |
Posted on 20-March-2017 11:44 | Category: News | comment[0] | trackback[0]
I am not surprised that Microsoft is going as far as inserting ads right inside Windows file explorer. All the contrary, I wonder what took them so long.
I think it would make sense to insert ads during a long copy/file. After all, Microsoft lacks any ethics, why should they put a limit to it ?
These are not necessarily personalized ads by the way. So it's unclear whether governments out there could sue Microsoft with this alone.
The intention is clear though, utter disrespect for users.
| | |
Posted on 10-March-2017 13:55 | Category: anti-Microsoft | comment[0] | trackback[0] Build 4.0.0.82 of xlsgen adds support for moving average charts. Again those charts are not supported by Excel, so the goal of xlsgen is to provide chart for everyday needs. 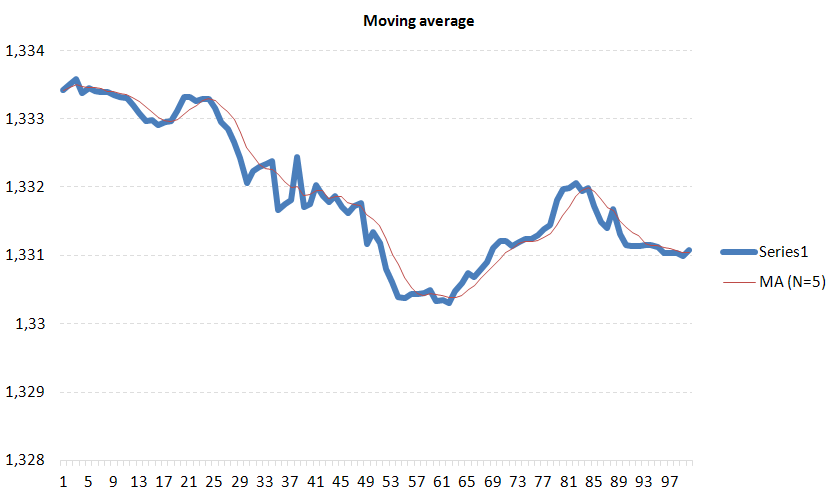 Moving average (N=5) Moving average (N=5)A moving average chart is a chart where a mathematical figure called average is calculated over time, resulting in a curve in and of itself. A moving average, by its nature, smooths out spikes, making it easier to see trends. This chart is often used in financial trading as a tool for analysis. The average calculation only takes a fraction, usually small, of past data, a parameter which is called N, which is why the chart is called moving average. By default, N=20, meaning that the point in that curve is defined by 20 older data points. The average, because it smoothens a signal, carries a late effect, which is obvious visually, which grows with the value of N. By opposite, the smaller N is, the tighter the average is to the data signal. Below are examples of the moving average with two other values of N, respectively 10 and 40. 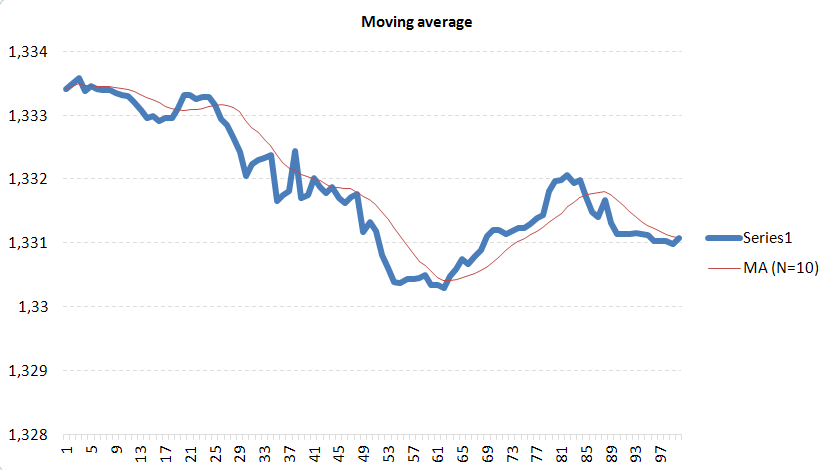 Moving average (N=10) Moving average (N=10) Moving average (N=40) Moving average (N=40)| C/C++ code |
xlsgen::IXlsWorkbookPtr wbk = engine->Open( L"EURUSD1.csv", L"output.xls" );

xlsgen::IXlsChartPtr chart1 = wbk->WorksheetByIndex[1]->NewChart(xlsgen::charttype_movingaverage, row1, col1, row2, col2);
xlsgen::IXlsChartDynamicDataSourceSeriesPtr serie1 = chart1->DynamicDataSource->AddSerie();
serie1->SeriesValuesFormula = L"=R1C3:R100C3";
chart1->SeriesByIndex[1]->DataWindowSelection = 40; // N=40
|
The DataWindowSelection property is available in each series of data in order to customize the value of N. | | |
Posted on 09-March-2017 20:15 | Category: xlsgen, Excel generator | comment[0] | trackback[0] Build 4.0.0.81 of xlsgen adds native support for Lorenz curves. Those charts are unknown to Excel so this is an original concept meant to match everyday needs.  Lorenz curve Lorenz curveThe Lorenz curve (named after Max Lorenz) represents the dispersion of inequalities, usually income, but not only. Wikipedia article. Points on the Lorenz curve represent statements like " the bottom 20% of all households have 10% of the total income.". A perfectly equal income distribution would be one in which every person has the same income (ideal curve displayed for comparison purposes). The Lorenz curve is always below the ideal curve. The data points on the horizontal axis shows the cumulated population and the data points on the vertical axis shows the cumulated income (or any other measure). The chart example above is made from the following data : | | Population | % Population | % Cumulated Population | Income | % Income | % Cumulated Income | | South | 43062 | 36.87% | 36.87% | 47961 | 34.06% | 34.06% | | Midwest | 26266 | 22.49% | 59.36% | 52209 | 22.62% | 56.68% | | Northeast | 21351 | 18.28% | 77.65% | 54283 | 19.12% | 75.80% | | West | 26105 | 22.35% | 100.00% | 56218 | 24.20% | 100.00% |
The Lorenz curve can be created from just raw Population and Income data, as is found in public files (government). xlsgen orders the data, computes cumuls and draws the line. | C/C++ code |
xlsgen::IXlsChartPtr chart1 = worksheet->NewChart(xlsgen::charttype_lorenzcurve, row1, col1, row2, col2);
xlsgen::IXlsChartDynamicDataSourceSeriesPtr serie1 = chart1->DynamicDataSource->AddSerie();
serie1->DataLabelsFormula = L"={43062;26266;21351;26105}";
serie1->SeriesValuesFormula = L"={47961;52209;54283;56218}";
|
| | |
Posted on 09-March-2017 20:12 | Category: xlsgen, Excel generator | comment[0] | trackback[0]
A ceux qui osent prétendre matchs de folie à l'aller comme au retour entre le Paris Saint Germain et le club de Barcelone, je réplique matchs truqués! Et les deux! Chacun des deux pour renverser les paris footbalistiques qui font comme chacun sait l'enjeu de grosses mannes financières.
Saupoudrez le tout de joueurs dopés, et vous avez une recette qui, dans d'autres sports, provoquerait d'autres unes de presse.
Mais faire l'hypothèse de la moralité et de l'intégrité des journalistes aujourd'hui, c'est de la folie. D'où cette situation.
| | |
Posted on 09-March-2017 11:31 | Category: France | comment[0] | trackback[0]
Build 4.0.0.80 of xlsgen fixes 2 memory leaks that were harming the ability to use xlsgen in server scenarios, i.e. loaded with plenty of user requests, or working for hours or even days behind a web server.
Memory leaks are the result of creating many internal data structures meant to compute so much stuff behind the scene and trying to optimize speed. Every now and then there must be a hold and check approach, as long as memory is not kept at regular levels, for making sure it is possible and even wise to keep adding more internal structures. After all, xlsgen is all the complexity of Excel, just without a user interface.
| | |
Posted on 05-March-2017 17:55 | Category: xlsgen, Excel generator | comment[0] | trackback[0] Build 4.0.0.79 of xlsgen adds support for rendering sparklines in all rendering scenarios, i.e. print, print preview, PDF, XPS and HTML.  sparklines rendered in xlsgen sparklines rendered in xlsgenFor preview and XPS, the screen DPI is used for rendering. For print, the printer DPI is used (usually much higher than the screen DPI). For PDF, vectors are used (the output scales at will). For HTML, screen DPI is used and small images are created as html resources. | | |
Posted on 03-March-2017 11:46 | Category: xlsgen, Excel generator | comment[0] | trackback[0] <-- previous page
|
This site
Home
Articles
DevTools
CPU-Z
EditPlus
ExplorerXP
Kill.exe
OllyDbg
DependencyWalker
Process Explorer
autoruns.exe
Araxis
COM Trace injection
CodeStats
NetBrute
FileMon/Regmon
BoundsChecker
AQTime profiler
Source monitor
GDI leaks tracking
Rootkit revealer
Rootkit removal
RunAsLimitedUser(1)
RunAsLimitedUser(2)
Liens
Le Plan B
Un jour à Paris
Meneame
Rezo.net (aggr)
Reseau voltaire
Cuba solidarity project
Le grand soir
L'autre journal
Le courrier suisse
L'Orient, le jour
Agoravox (aggr)
|