XEROF


xlsgen 4.0.0.10 : New chart : Excel 2016 sunburst


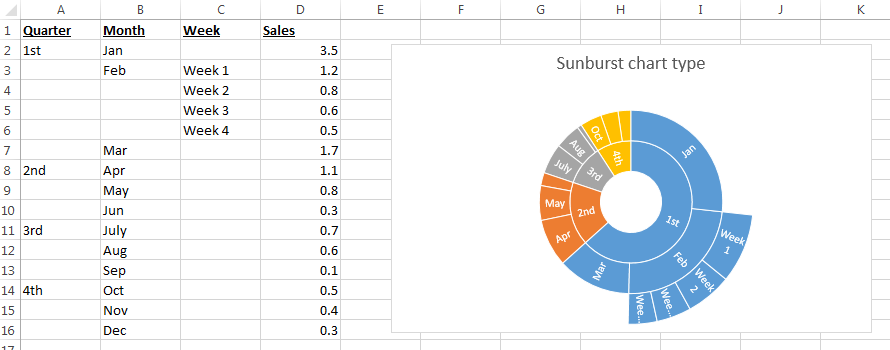
Build 4.0.0.10 of xlsgen adds support for creating Excel 2016 sunburst charts. As the name implies, these are Excel 2016 charts in that only Excel 2016 will render those charts, no older Excel version will do. xlsgen reads, creates and writes such charts.


Sunburst charts in xlsgen

Sunburst chart is another chart type for showing data which is hierarchical in nature. It is made of multiple rings which reflects the hierarchy, and as such is different from a doughnut chart or exploded pie chart, which xlsgen also supports. A segment of the inner circle bears a hierarchical relationship to those segments of the outer circle which lie within the angular sweep of the parent segment. The multiple rings are created from a single series of values associated to multiple columns of categories, reflecting the hierarchies, for instance a quarter/month/week hierarchy as in the example above.

And here is how you do it (in VB) :


Dim chart As IXlsChart
Set chart = worksheet.NewChart(enumChartType.charttype_sunburst, _
10, _ 'row1
2, _ 'col1
25, _ 'row2
10 _ 'col2
)

Dim s1 As IXlsChartDynamicDataSourceSeries
Set s1 = chart.DynamicDataSource.AddSerie
s1.SeriesValuesFormula = "=Sheet1!$D$2:$D$16"
s1.DataLabelsFormula = "=Sheet1!$A$2:$C$16"


Posted on 18-November-2015 09:55 | Category: xlsgen, Excel generator | comment[0] | trackback[0]


xlsgen 4.0.0.9 : New chart : Excel 2016 treemap


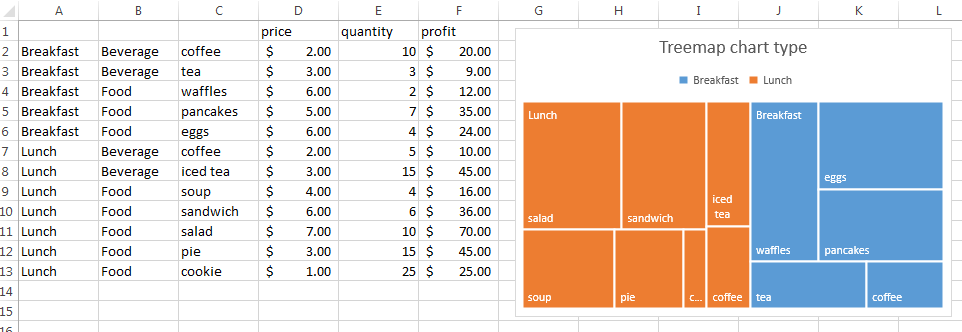
Build 4.0.0.9 of xlsgen adds support for creating Excel 2016 treemap charts. As the name implies, these are Excel 2016 charts in that only Excel 2016 will render those charts, no older Excel version will do. xlsgen reads, creates and writes such charts.


Treemap charts in xlsgen

Treemap charts can be used to display values which are hierarchical in nature, using nested rectangles.

In the example above, we have a single series of values, which is the price column, and we would like to show how breakfasts are sorted out by price, and how lunches are sorted out by price. The display builds two separate collections from the same series, based on names from column A and column C, sorts them, according to column D, then displays the nested rectangles.

And here is how to create such chart (c#) :


IXlsChart chart = worksheet.NewChart(enumChartType.charttype_treemap,
10, //row1
2, //col1
25, //row2
10 //col2
);

IXlsChartDynamicDataSourceSeries s1 = chart.DynamicDataSource.AddSerie();
s1.SeriesValuesFormula = "=Sheet1!$D$2:$D$13";
s1.DataLabelsFormula = "=Sheet1!$A$2:$C$13";


Posted on 18-November-2015 09:46 | Category: xlsgen, Excel generator | comment[0] | trackback[0]


<-- previous page

< November >
0102030405
0607080910
1112131415
1617181920
2122232425
2627282930


This site
Home
Articles

DevTools
CPU-Z
EditPlus
ExplorerXP
Kill.exe
OllyDbg
DependencyWalker
Process Explorer
autoruns.exe
Araxis
COM Trace injection
CodeStats
NetBrute
FileMon/Regmon
BoundsChecker
AQTime profiler
Source monitor
GDI leaks tracking
Rootkit revealer
Rootkit removal
RunAsLimitedUser(1)
RunAsLimitedUser(2)


Liens
Le Plan B
Un jour à Paris
Meneame
Rezo.net (aggr)
Reseau voltaire
Cuba solidarity project
Le grand soir
L'autre journal
Le courrier suisse
L'Orient, le jour
Agoravox (aggr)