Build 4.0.0.90 of xlsgen brings supports to resistance trendlines, for financial decision making.
Support and resistance trendlines are used in stock trading to delimit peer pressure for, respectively, selling and buying stocks. Any time the stock data crosses the support line or the resistance line, this acts as a trade signal. Support and resistance play an opposite role.
The support line marks the signal for selling stocks, or for shorting stocks (i.e. buying on the prediction that stocks will go lower). The resistance line marks the signal for buying stocks, or for longing stocks (i.e. buying on the prediction that stocks will go higher).
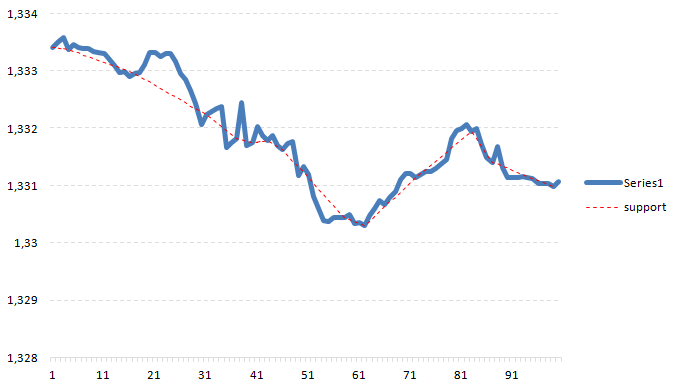
 Support and Resistance trend lines in xlsgen
xlsgen completely hides the underlying complexity of calculating support and resistance trendlines. Those lines are calculated based on 10-period smoothed data and the calculation of local minimum and maximum spots which are then interpolated together.
| C/C++ code |
xlsgen::IXlsWorkbookPtr workbook = engine->Open( L"EURUSD1.csv", L"support_resistance.xlsx" );

xlsgen::IXlsChartPtr chart = workbook->WorksheetByIndex[1]->NewChart(xlsgen::charttype_line2D,
                                                     1, //row1
                                                     2, //col1
                                                     28, //row2
                                                     15 //col2
                                                     );

xlsgen::IXlsChartDynamicDataSourceSeriesPtr serie001s0ss0 = chart->DynamicDataSource->AddSerie();
serie001s0ss0->SeriesValuesFormula = L"=R1C3:R100C3";

chart->SeriesByIndex[1]->TrendLines[1]->Show = xlsgen::charttrendline_support; // Support trendline

chart->SeriesByIndex[1]->TrendLines[1]->Options->Type = xlsgen::chartbordertype_custom;
chart->SeriesByIndex[1]->TrendLines[1]->Options->Style = xlsgen::chartborderstyle_dot;
chart->SeriesByIndex[1]->TrendLines[1]->Options->Weight = xlsgen::chartborderweight_single;
chart->SeriesByIndex[1]->TrendLines[1]->Options->Color = 0xFF0000;

chart->SeriesByIndex[1]->TrendLines[2]->Show = xlsgen::charttrendline_resistance; // Resistance trendline

chart->SeriesByIndex[1]->TrendLines[2]->Options->Type = xlsgen::chartbordertype_custom;
chart->SeriesByIndex[1]->TrendLines[2]->Options->Style = xlsgen::chartborderstyle_dot;
chart->SeriesByIndex[1]->TrendLines[2]->Options->Weight = xlsgen::chartborderweight_single;
chart->SeriesByIndex[1]->TrendLines[2]->Options->Color = 0x00FF00;

workbook->WorksheetByIndex[1]->Export->ExportAsPDF(L"support_resistance.pdf"); // ask xlsgen to compute and render it

workbook->Close();
|