Build 3.0.0.122 of xlsgen enables year over over differences scenarios in business intelligence.
Year over year differences allows to compute the difference in raw or in percent between say Q2 2013 and Q2 2012.
This is a very important block of financial report building.
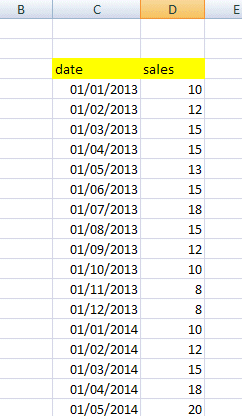
 Year over year differences. Above is the data source used as input
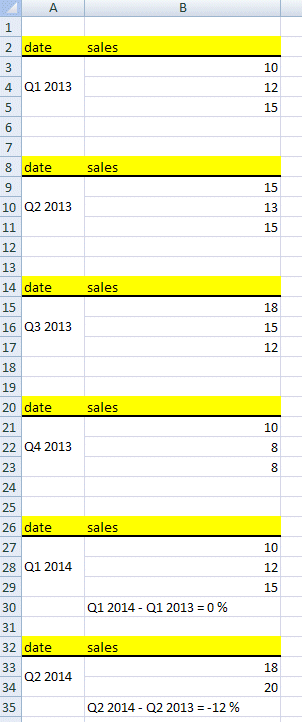
 Year over year differences in rows 30 and 35. The financial report, calculated by xlsgen
In the example above, the source data has sales value for a 6 quarter period. For the 4 first quarters, the computation can't compute differences since it does not have the data to compare to. But for the remaining two quarters, it can, and that is what the following source code does :
(C#)
IXlsWorksheet wksht = workbook.get_WorksheetByIndex(1);

// automatically infer the data structure (data types, headers, ...)

wksht.Tables.InferFromWorksheet();

// break time data by quarter

IXlsTableColumn tcDates = wksht.Tables.get_Item(1).DataResults.Columns.get_ItemByName("date");

tcDates.Map.TimeSeries(enumFormulaLanguage.formulalanguage_en, enumMapTimeSeries.timeseries_quarters, true);

IXlsTableBreaks pb = tcDates.Breaks;
pb.DistinctValues();

// year-over-year differences (eg. Q2 2013 compared to Q2 2012)

IXlsTableColumn tcSales = wksht.Tables.get_Item(1).DataResults.Columns.get_ItemByName("Sales");

IXlsTableSubtotal st = pb.Subtotals.Add(tcSales);
st.BuiltinFunction = enumSubtotalFunction.subtotalfunc_diffp;

pb.Apply();

// group by

tcDates.GroupBy(enumGroupBy.groupby_showmergedcells);

// insert the financial report

IXlsWorksheet wksht_yoy = workbook.AddWorksheet("Year over year");

wksht_yoy.InsertTableAt(wksht.Tables.get_Item(1), 2, 1);


