XEROF


xlsgen 4.0.0.82 : New financial chart : moving average


Build 4.0.0.82 of xlsgen adds support for moving average charts. Again those charts are not supported by Excel, so the goal of xlsgen is to provide chart for everyday needs.


Moving average (N=5)


A moving average chart is a chart where a mathematical figure called average is calculated over time, resulting in a curve in and of itself. A moving average, by its nature, smooths out spikes, making it easier to see trends. This chart is often used in financial trading as a tool for analysis.

The average calculation only takes a fraction, usually small, of past data, a parameter which is called N, which is why the chart is called moving average. By default, N=20, meaning that the point in that curve is defined by 20 older data points. The average, because it smoothens a signal, carries a late effect, which is obvious visually, which grows with the value of N. By opposite, the smaller N is, the tighter the average is to the data signal.

Below are examples of the moving average with two other values of N, respectively 10 and 40.


Moving average (N=10)


Moving average (N=40)


C/C++ code

xlsgen::IXlsWorkbookPtr wbk = engine->Open( L"EURUSD1.csv", L"output.xls" );

xlsgen::IXlsChartPtr chart1 = wbk->WorksheetByIndex[1]->NewChart(xlsgen::charttype_movingaverage, row1, col1, row2, col2);
xlsgen::IXlsChartDynamicDataSourceSeriesPtr serie1 = chart1->DynamicDataSource->AddSerie();
serie1->SeriesValuesFormula = L"=R1C3:R100C3";
chart1->SeriesByIndex[1]->DataWindowSelection = 40; // N=40


The 
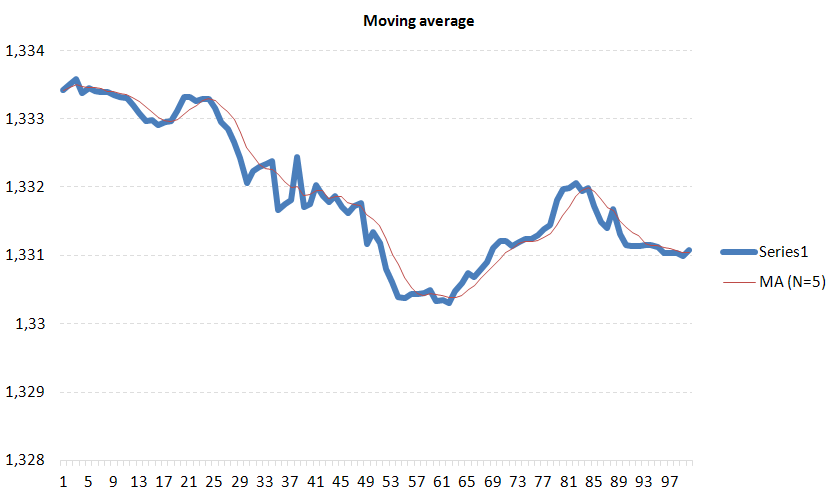
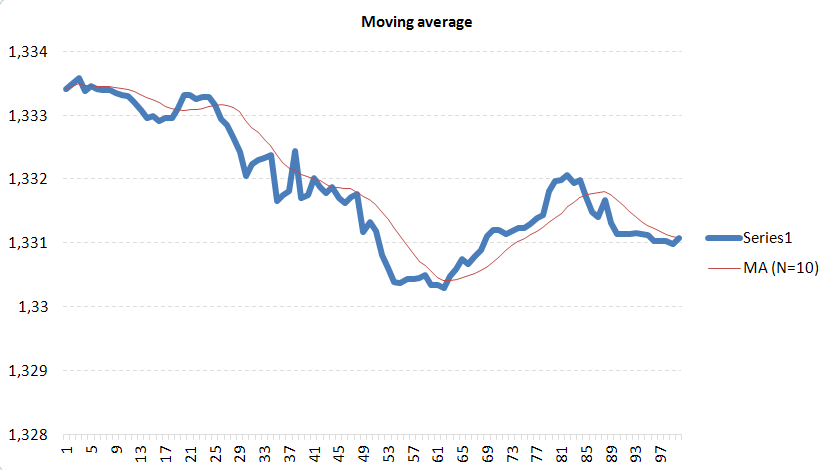
DataWindowSelection property is available in each series of data in order to customize the value of N.

Posted on 09-March-2017 20:15 | Category: xlsgen, Excel generator | comment[0] | trackback[0]


xlsgen 4.0.0.81 : New financial chart : Lorenz curve


Build 4.0.0.81 of xlsgen adds native support for Lorenz curves. Those charts are unknown to Excel so this is an original concept meant to match everyday needs.


Lorenz curve


The Lorenz curve (named after Max Lorenz) represents the dispersion of inequalities, usually income, but not only. Wikipedia article.

Points on the Lorenz curve represent statements like "the bottom 20% of all households have 10% of the total income.". A perfectly equal income distribution would be one in which every person has the same income (ideal curve displayed for comparison purposes). The Lorenz curve is always below the ideal curve.

The data points on the horizontal axis shows the cumulated population and the data points on the vertical axis shows the cumulated income (or any other measure).

The chart example above is made from the following data :
 Population% Population% Cumulated PopulationIncome% Income% Cumulated Income
South4306236.87%36.87%4796134.06%34.06%
Midwest2626622.49%59.36%5220922.62%56.68%
Northeast2135118.28%77.65%5428319.12%75.80%
West2610522.35%100.00%5621824.20%100.00%


The Lorenz curve can be created from just raw Population and Income data, as is found in public files (government). xlsgen orders the data, computes cumuls and draws the line.

C/C++ code

xlsgen::IXlsChartPtr chart1 = worksheet->NewChart(xlsgen::charttype_lorenzcurve, row1, col1, row2, col2);
xlsgen::IXlsChartDynamicDataSourceSeriesPtr serie1 = chart1->DynamicDataSource->AddSerie();
serie1->DataLabelsFormula = L"={43062;26266;21351;26105}";
serie1->SeriesValuesFormula = L"={47961;52209;54283;56218}";


Posted on 09-March-2017 20:12 | Category: xlsgen, Excel generator | comment[0] | trackback[0]


Football : matchs truqués


A ceux qui osent prétendre matchs de folie à l'aller comme au retour entre le Paris Saint Germain et le club de Barcelone, je réplique matchs truqués! Et les deux! Chacun des deux pour renverser les paris footbalistiques qui font comme chacun sait l'enjeu de grosses mannes financières.

Saupoudrez le tout de joueurs dopés, et vous avez une recette qui, dans d'autres sports, provoquerait d'autres unes de presse.

Mais faire l'hypothèse de la moralité et de l'intégrité des journalistes aujourd'hui, c'est de la folie. D'où cette situation.

Posted on 09-March-2017 11:31 | Category: France | comment[0] | trackback[0]


<-- previous page

< March >
0102030405
0607080910
1112131415
1617181920
2122232425
2627282930
31


This site
Home
Articles

DevTools
CPU-Z
EditPlus
ExplorerXP
Kill.exe
OllyDbg
DependencyWalker
Process Explorer
autoruns.exe
Araxis
COM Trace injection
CodeStats
NetBrute
FileMon/Regmon
BoundsChecker
AQTime profiler
Source monitor
GDI leaks tracking
Rootkit revealer
Rootkit removal
RunAsLimitedUser(1)
RunAsLimitedUser(2)


Liens
Le Plan B
Un jour à Paris
Meneame
Rezo.net (aggr)
Reseau voltaire
Cuba solidarity project
Le grand soir
L'autre journal
Le courrier suisse
L'Orient, le jour
Agoravox (aggr)